
3-GIS | Diagramming

Share connectivity data with clarity

3-GIS | Diagramming turns network connectivity data into standardized diagrams that teams can use across design, construction, and operations. Replace manual drafting with data-driven outputs that keep connectivity details complete, current, and consistent.

Contact us
Explore 3-GIS | Web
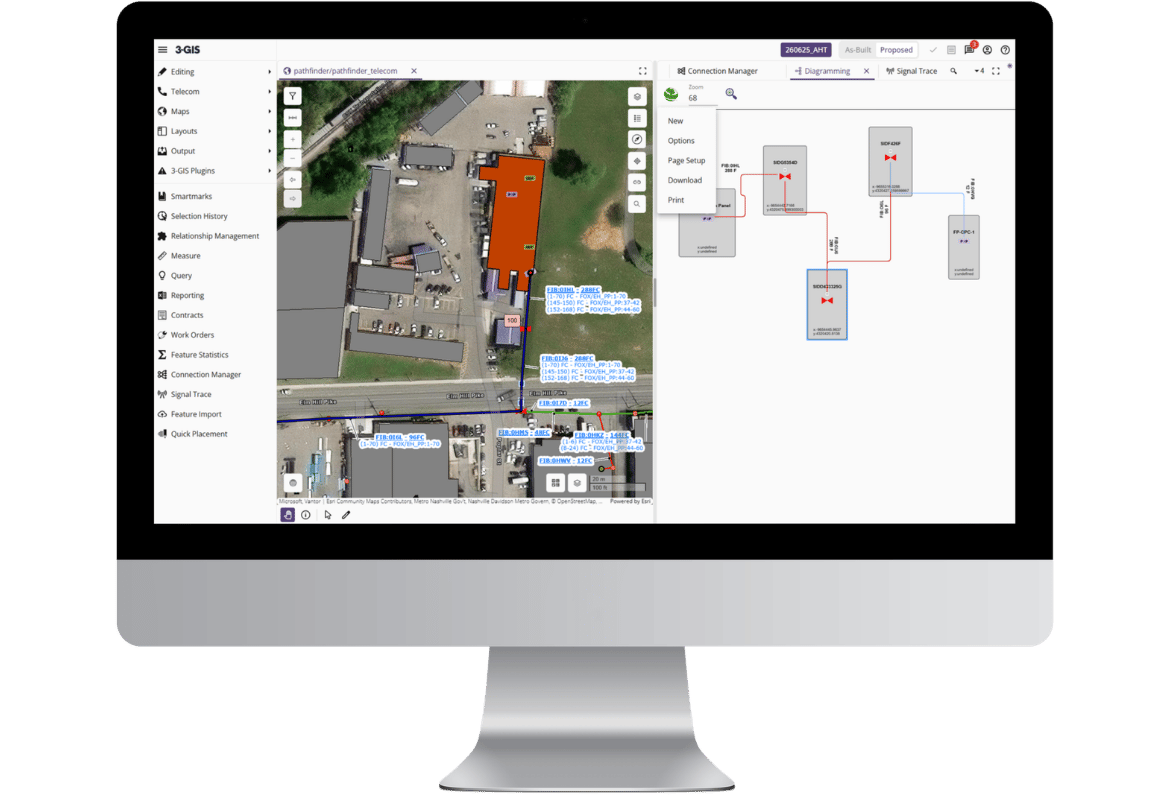
3-GIS | Diagramming on monitor

Network diagrams without manual drafting

3-GIS | Diagramming uses connectivity details from 3-GIS | Web to generate standardized visual outputs for design reviews, construction packages, troubleshooting, and stakeholder communication. Instead of recreating diagrams manually, users can generate consistent deliverables that stay aligned with the network record.

Connectivity clarity

Turn network data into context

Network connectivity is valuable, but only if people can understand and use it. 3-GIS | Diagramming equips teams with the tools needed to convert complex network relationships into clear, shareable visuals that support reviews, handoffs, troubleshooting, and decisions outside the map.

Man wearing blue shirt holding tablet

See connectivity from every angle

Configure and export diagrams to facilitate the project at hand. Inspect signal paths, validate network relationships, and communicate how assets connect across the network.

Simplify views
Review connections
Understand changes
Share context
Isolate the details

Present connectivity in a focused visual format so stakeholders can review the relationships and routes that matter without needing a full map view.

Validate network relationships

Use diagrams to review how equipment, cables, and connections relate before sharing information, making updates, or moving work forward.

See downstream impact

Show how an issue, update, or planned change carries through the network, making downstream effects easier to evaluate and explain.

Support every handoff

Turn connectivity data into a visual reference teams can use across conversations outside 3-GIS | Web.

Why diagramming matters

Network connectivity drives planning, engineering, operations, field work, and customer-facing decisions. 3-GIS | Diagramming adapts that information into visual context teams can review, share, and act on.

1 icon


Make relationships visible

Turn detailed connectivity data into diagrams that show how routes, assets, and connection points relate across the network.

2 icon


Create shared understanding

Give teams a common visual reference for discussing connectivity to reduce the back-and-forth that happens when network details are interpreted differently.

3 icon


Support faster decisions

Put the right network context in front of the right people so reviews, troubleshooting, and next steps can move with less back-and-forth.

Related products

Explore the 3-GIS ecosystem

3-GIS | Diagramming extends the value of your network data by turning managed connectivity into focused visuals that support review, communication, and decision-making.

3-GIS | Web

Maintain the fiber network data Diagramming uses to generate visual views of routes, relationships, equipment, and connectivity.
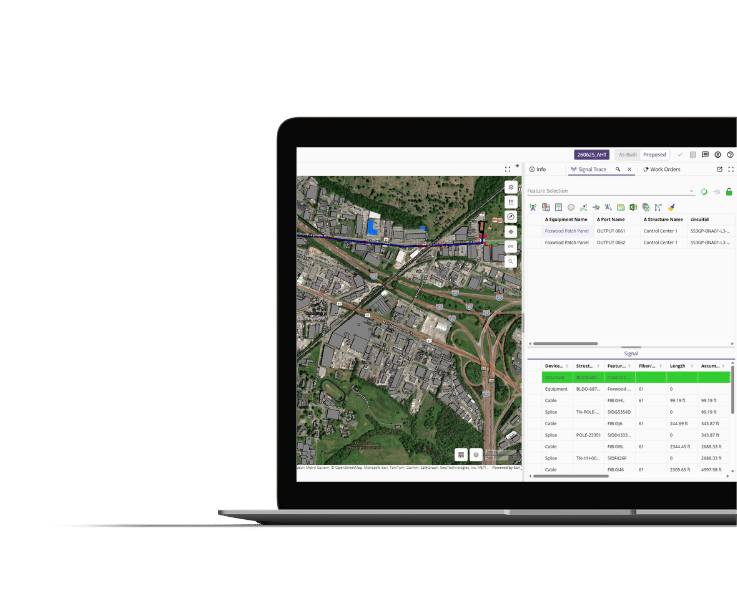
3-GIS | Web

3-GIS | Admin

Set the data structure and configuration behind reliable diagrams, from rules and roles to the workflows that keep network information consistent.
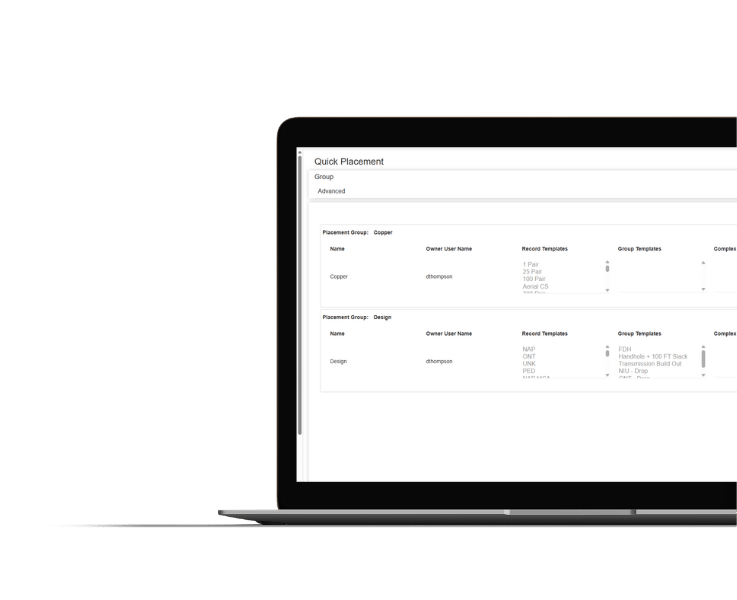
3-GIS | Admin

3-GIS | Web

Enterprise APIs

Connect 3-GIS | Web network data with business systems, operational workflows, and internal tools through governed API access.
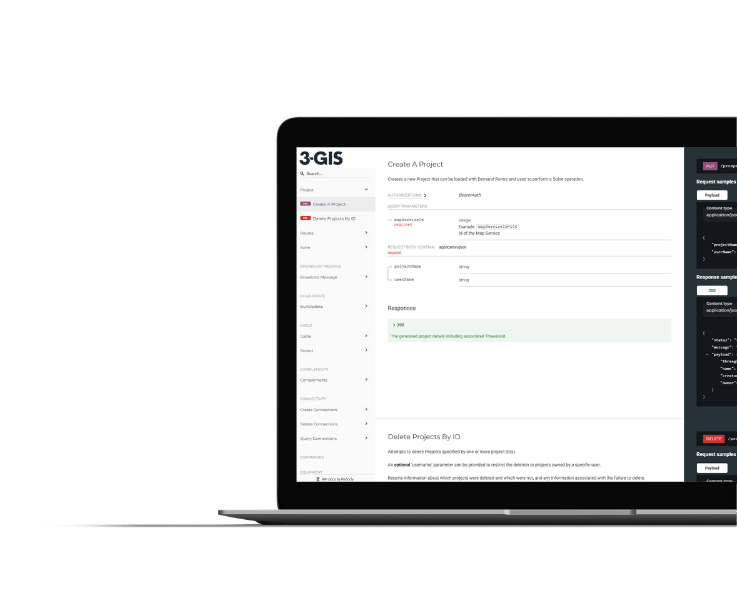
3-GIS | Web Enterprise APIs
 

3-GIS | Diagramming FAQs

Related resources

Make network context easier to use

Explore resources on connectivity visualization, network documentation, and using trusted GIS data to support reviews, handoffs, and operations.
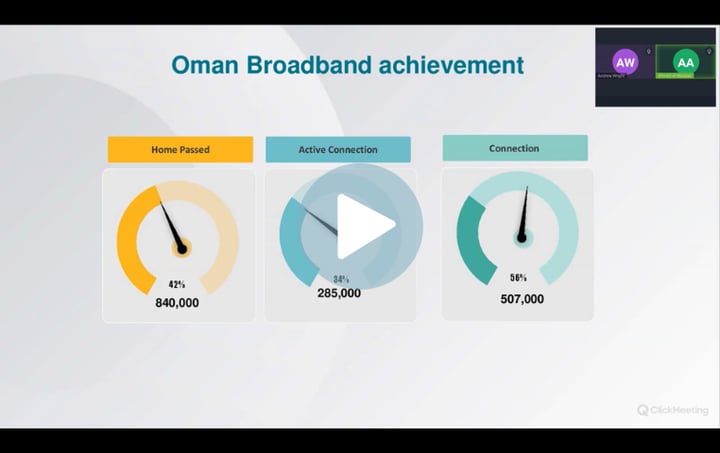

Oman Broadband Image
Telecom | Case study Oman Broadband Oman Broadband brought national fiber rollout into sharper focus with a centralized GIS-based system for managing network data, coordinating teams, and supporting service delivery.
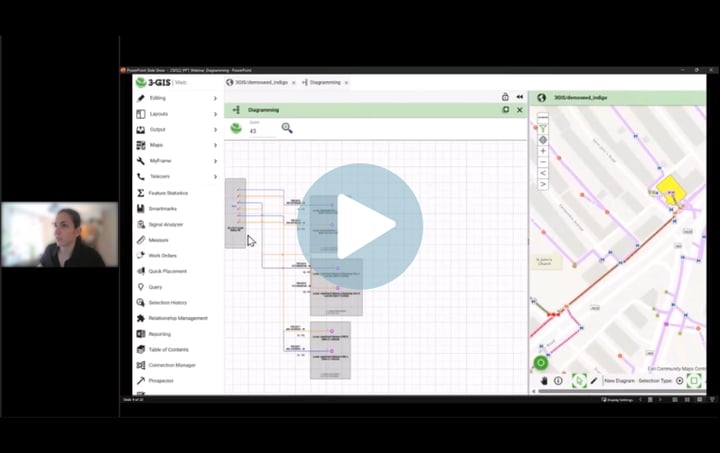
Real-time network diagramming: Added clarity for complex builds Image
Telecom | Webinar Real-time network diagramming: Added clarity for complex builds Outdated, static network diagrams can slow down builds and cause miscommunication. In this on-demand session we show how real-time diagramming solves this by instantly generating and updating accurate, shareable visuals to keep teams aligned and projects moving.
3-GIS | Diagramming Image
Telecom | Product spec sheet 3-GIS | Diagramming 3-GIS | Diagramming turns network data into configurable visual outputs, helping teams isolate details, understand connectivity, and communicate network changes more clearly.

Ready for a clearer view?

Put Diagramming to work

Let’s discuss how your team can use 3-GIS | Diagramming to turn connectivity data into focused visual outputs. 

Contact us
Explore 3-GIS | Web